The current Shiba Inu price is $0.0000118 USD, with a market cap of approximately $6.9 billion, making it the 23rd largest cryptocurrency by market value. I’ve tracked SHIB’s price movements closely, and this meme token continues to show significant volatility with daily price swings that can impact your investment quickly.

The shiba inu community, known as the “Shiba Army,” drives much of the token’s price action through social media campaigns and burning initiatives. I’ll walk you through the key factors that move SHIB’s price, from market sentiment to whale movements, so you can better understand this popular meme coin’s behavior.
Understanding SHIB’s price dynamics requires looking beyond simple charts. The shiba inu ecosystem includes multiple tokens, decentralized exchange features, and community-driven initiatives that all influence the main token’s value in ways that traditional cryptocurrencies don’t experience.
Key Takeaways
- SHIB trades 24/7 with high volatility driven by community sentiment and social media activity
- The token’s massive supply and community burning campaigns directly impact its price movements
- Current market data shows SHIB trading near key support levels with mixed technical indicators
Live SHIB Price & Change
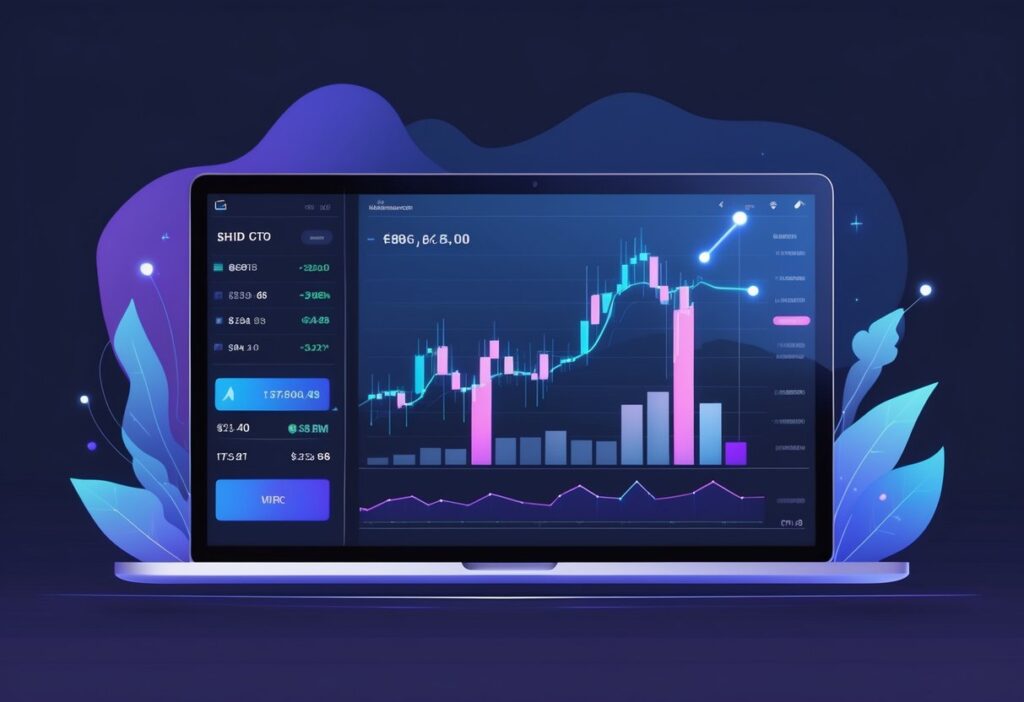
SHIB currently trades at approximately $0.000012 USD with recent price movements showing typical cryptocurrency volatility. The token has experienced fluctuations in both daily and yearly timeframes that reflect broader market trends.
Don’t know what SHIB is? Read this article – What is Shiba Inu | Definitions & Facts
Intraday Chart (1 Day)
The current SHIB price sits at $0.000012 with daily trading activity showing moderate volatility. Based on recent data, SHIB has moved down by approximately 1.99% in the last 24 hours.
Daily trading volume remains active at around $119 million USD. This volume indicates steady interest from traders despite the slight price decline.
The intraday movements typically show small percentage changes due to SHIB’s low price point. Even minor shifts in demand can create noticeable percentage moves.
Key Daily Metrics:
- Current Price: ~$0.000012 USD
- 24h Change: -1.99%
- Trading Volume: $119.02M USD
I notice the price action often follows broader cryptocurrency market sentiment throughout each trading day.
Historical Chart (1 Year)
Looking at SHIB’s yearly performance, the token has shown significant volatility compared to its all-time high. The historical data shows SHIB reached its peak at ₹0.0077 on September 9, 2021, representing an 87% decline from current levels.
Over the past 30 days, SHIB has fluctuated by approximately 10.58%. This range demonstrates the ongoing price discovery process typical of meme cryptocurrencies.
The yearly chart reveals several major price cycles. These patterns often correlate with broader crypto market movements and social media attention.
Annual Price Points:
- All-Time High: $0.0077 (Sept 2021)
- Current Level: ~87% below peak
- 30-Day Range: 10.58% fluctuation
The long-term trend shows SHIB trading within established support and resistance levels throughout most of the year.
Key Stats (Bullets)
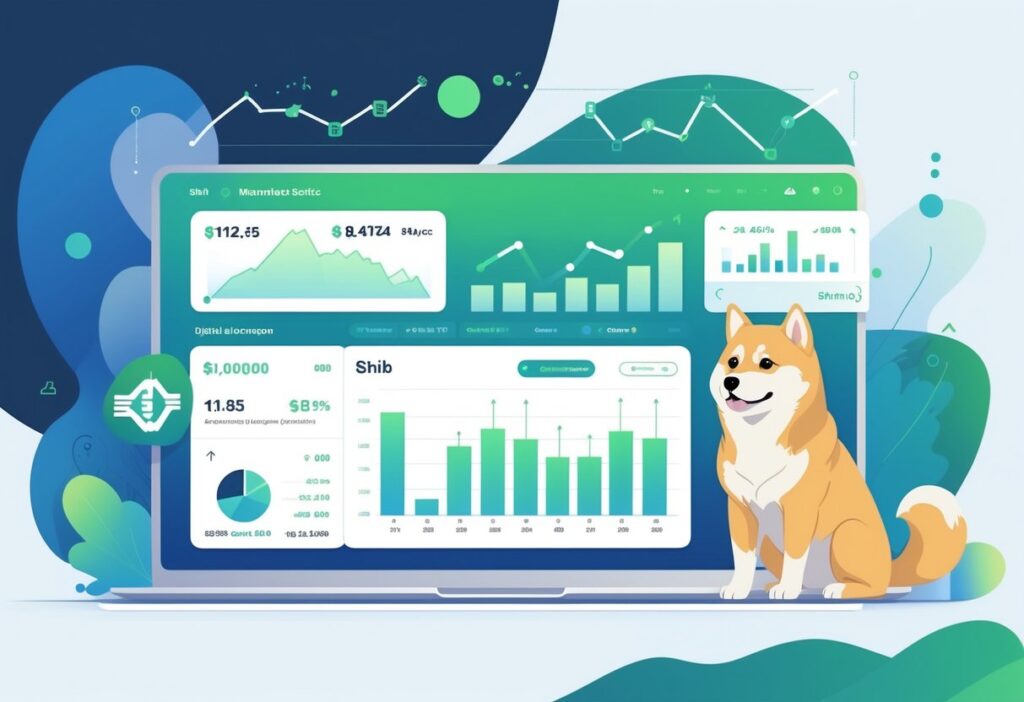
Here are the key statistics for Shiba Inu that I track regularly:
Current Price & Market Position • Current price: $0.0000117 with a 1.75% increase in 24 hours • Market cap: $6.9 billion, ranking #23 globally • Fully diluted valuation (FDV): $6.9 billion
Supply Metrics • Circulating supply: 589,255,151,920,720 SHIB tokens • Total supply: 589.5 trillion tokens • Max supply: No limit set
Trading Activity • 24-hour trading volume: $27.2 million • Trading volume rank: #99 with a 5.86% decrease • 24-hour price range: $0.0000115 – $0.0000119
Performance Data • All-time high: $0.0000725 (down 83.82% from peak) • 52-week range: $0.0000101 – $0.0000333 • Year-to-date performance: -26.37% against USD
Market Indicators • Technical analysis: 4 bearish, 2 bullish, 5 neutral signals • Token holders: Over 1.1 million wallet addresses • Platform: ERC-20 token on Ethereum blockchain
Latest News & Drivers

SHIB outflows from exchanges have surged by 883%, indicating major whale activity and investor behavior changes. This massive movement of tokens off exchanges suggests reduced selling pressure.
I’ve observed several key drivers behind this trend. Profit-taking remains a primary factor as traders lock in gains amid recent price volatility.
Whale movements dominate the outflows. Large holders are transferring their meme coin holdings to private wallets for long-term storage or staking purposes.
The ecosystem expansion continues to attract attention. ShibaSwap and the Shibarium Layer-2 solution provide new utility beyond the original meme token concept.
Key developments include:
- TREAT token launch confirmed for January 14, 2025
- Burn rate increased by 2,229% with over 21 million tokens burned
- ShibaSwap V2 development underway
Recent price action shows SHIB trading at $0.0000118 with significant daily trading volume. The memecoin benefits from strong community support and growing ecosystem utility.
I’m tracking how these outflows could signal either bullish accumulation or preparation for large-scale selling. The shiba inu token’s evolution from simple meme coin to ecosystem player continues driving investor interest.
Long-term holders appear confident in the cryptocurrency’s roadmap. This confidence stems from expanding use cases and active development within the broader Shiba Inu ecosystem.
What Moves SHIB?
Several key factors drive SHIB’s price movements. I’ve observed that whale activity plays a major role, with large transactions reaching 4.3 trillion SHIB during market dips.
Token burns create deflationary pressure. The burn rate recently spiked over 8,400% when anonymous wallets destroyed billions of tokens.
Ecosystem development affects price momentum. Shibarium, the Layer-2 blockchain solution, burns SHIB tokens through gas fees. ShibaSwap, the project’s decentralized exchange, enables staking and DeFi activities on the Ethereum network.
Market sentiment heavily influences SHIB’s performance. The token’s connection to Dogecoin creates correlation during meme coin rallies.
Key Price Drivers:
- Whale accumulation – Large investors buying or selling
- Exchange flows – Tokens moving to/from wallets
- Burn events – Permanent token removal from supply
- DeFi integration – New staking and DEX opportunities
- Technical patterns – Chart formations signaling breakouts
Supply dynamics remain challenging. SHIB’s massive supply of 589.25 trillion tokens creates resistance compared to other cryptocurrencies.
Shibarium’s growth expands utility beyond meme coin status. The blockchain hosts various projects and creates natural burn mechanisms through network activity.
I notice that retail investor interest often follows whale movements, amplifying price swings in both directions.
Trading Hours & Settlement
I can trade SHIB 24 hours a day, 7 days a week. Cryptocurrency markets never close like traditional stock markets do.
Trading Availability:
- 24/7 trading on all major exchanges
- No weekends off or holidays
- Continuous price updates around the clock
Most exchanges process my SHIB trades instantly. The actual settlement depends on the blockchain network speed.
Settlement Times:
- Instant trading on exchange platforms
- Blockchain confirmation takes 1-5 minutes
- Withdrawal processing varies by exchange
| Settlement Type | Time Frame |
|---|---|
| Exchange Trading | Instant |
| Blockchain Confirmation | 1-5 minutes |
| Withdrawal to Wallet | 10-30 minutes |
I notice that SHIB trading volume stays active throughout different time zones. Asian markets often show higher activity during their business hours.
Peak Trading Hours:
- Asian markets: 9 PM – 3 AM EST
- European markets: 3 AM – 9 AM EST
- US markets: 9 AM – 5 PM EST
Exchange maintenance can temporarily pause trading. Most platforms schedule maintenance during low-volume periods to minimize impact.
I can set limit orders that execute automatically when SHIB reaches my target price. This helps me trade even when I’m not actively monitoring the market.
Related Indices & ETFs
Currently, I cannot find any approved SHIB ETFs trading on major exchanges. The cryptocurrency market has seen Bitcoin and Ethereum ETFs gain approval, but meme coins like SHIB remain without dedicated ETF products.
However, the SHIB community is actively pushing for ETF consideration. Community leaders highlight SHIB’s presence on over 110 exchanges with 212 trading pairs as strong evidence for ETF viability.
Available Investment Options:
- Direct Purchase: I can buy SHIB on major exchanges like Coinbase
- Futures Trading: SHIB futures are available with growing institutional interest
- Index Tracking: Some crypto index funds include SHIB alongside BTC and ETH
The growing institutional interest in SHIB futures signals potential ETF development. Open interest in SHIB derivatives recently increased by 3.5% to $121.69 million.
Comparison to Established Crypto ETFs:
Unlike Bitcoin ETFs that have attracted billions in inflows, SHIB lacks regulatory approval for ETF products. Ethereum ETFs exist but have seen mixed reception compared to Bitcoin.
DOGE has also received ETF filing attention, with Grayscale submitting proposals. This suggests meme coins may eventually gain ETF access.
Major platforms like Uniswap and traditional cryptocurrency exchanges continue expanding SHIB trading pairs, potentially strengthening future ETF applications.
Common Questions On SHIB Price Data
SHIB price data updates continuously during market hours, but the cryptocurrency doesn’t follow traditional stock market schedules. You cannot trade SHIB price indices directly since they serve as reference points rather than tradeable assets.
How Often Is The Price Updated?
SHIB price data updates in real-time throughout the day and night. Most exchanges refresh their live SHIB prices every few seconds when trading activity occurs.
I’ve observed that major platforms like CoinMarketCap and CoinGecko aggregate data from multiple exchanges. They typically update prices within 10-30 seconds of trades happening on major exchanges.
The frequency depends on trading volume. During high-volume periods, prices may update every second. During quieter times, updates might occur every 30-60 seconds.
Key update intervals:
- High volume: 1-5 seconds
- Normal volume: 10-30 seconds
- Low volume: 30-60 seconds
Price aggregators collect data from dozens of exchanges simultaneously. This creates a weighted average that represents the most accurate market price at any given moment.
Why Doesn’t The Index Trade On Weekends?
SHIB actually trades 24/7, including weekends. Unlike traditional stock markets, cryptocurrency markets never close for weekends or holidays.
I can buy and sell SHIB any time of day or night. The confusion often comes from people comparing crypto to stock indices, which do pause over weekends.
Crypto vs. Stock Markets:
- SHIB: Trades 24/7/365
- Stock indices: Close weekends and holidays
- Forex: Limited weekend trading
Some price tracking websites might show reduced activity on weekends. This happens because fewer institutional traders participate, not because the market closes.
Weekend trading often shows lower volume but maintains full functionality. SHIB’s price movements continue around the clock regardless of traditional market schedules.
Can I Trade The Index Directly?
I cannot trade SHIB price indices directly. Indices serve as reference points that track price movements across multiple exchanges.
Instead, I trade the actual SHIB token on cryptocurrency exchanges. The index simply shows me what the average price looks like across all trading platforms.
What I can trade:
- SHIB tokens on exchanges
- SHIB futures contracts
- SHIB options (limited availability)
What I cannot trade:
- Price indices themselves
- Index funds tracking SHIB
- ETFs based on SHIB indices
When I want SHIB exposure, I purchase the actual tokens through exchanges like Binance, Coinbase, or Kraken. These platforms let me buy real SHIB that I can store in my wallet.
The index helps me understand fair market value before making trades. It shows me if a particular exchange has unusually high or low prices compared to the overall market.
Frequently Asked Questions
SHIB’s price depends on several key factors including token burns, market sentiment, and trading volume. The current price sits around $0.000012 with analysts setting various targets based on technical indicators and market conditions.
I can identify several key factors that drive SHIB’s price movements. Community-driven token burns significantly impact value by reducing the total supply in circulation.
Market sentiment plays a major role in SHIB’s price changes. When Bitcoin gains dominance, meme coin interest typically fades as traders chase gains with the top cryptocurrency.
Trading volume and community strength also affect SHIB’s value. The strength of the Shiba Inu community and how many people actively use the token directly impacts its market performance.
SHIB currently trades at a much lower individual token price than Dogecoin. While Dogecoin typically trades in cents, SHIB’s current price is around $0.000012 with a market cap of approximately $7 billion.
Both tokens compete in the meme coin category but have different supply structures. SHIB has a much larger total supply, which keeps the individual token price significantly lower than Dogecoin’s price per coin.
The market caps provide a better comparison than individual token prices. Both cryptocurrencies experience similar volatility patterns during market corrections and rallies.
I see analysts setting specific price targets based on technical analysis. Current predictions include targets of $0.000085171, $0.000183312, and $0.000472905 if buying pressure increases.
Some analysts focus on shorter-term resistance levels. Key resistance points sit at $0.00001405, $0.000016, and $0.000018 based on current chart patterns.
Long-term predictions vary widely among experts. Some projections suggest SHIB could reach higher valuations by 2040, though these remain speculative forecasts.
I recommend using established cryptocurrency tracking platforms for real-time SHIB data. Major platforms like CoinLore provide current prices, market caps, and trading volumes updated regularly throughout the day.
These platforms show important metrics beyond just price. You can track daily trading volume, which recently hit $24.4 million USD, and monitor market capitalization changes.
Most tracking sites also provide historical charts and technical indicators. This data helps you understand price patterns and volatility over different time periods.
I consider SHIB’s all-time high as a key reference point. The token reached its peak price of $0.0000725 since its launch in July 2020.
Recent performance shows significant volatility patterns. SHIB dropped 10% in one month as of July 2025, reflecting broader market trends affecting meme coins.
Launch timing and market cycles matter for context. SHIB entered the market during a major crypto bull run, which influenced its initial price discovery and subsequent corrections.
I must address the mathematical reality of SHIB reaching $1. With the current massive supply of tokens, a $1 price would create a market cap larger than the entire global economy.
Token burns would need to eliminate trillions of coins for $1 to become possible. Even with recent burn rate increases of over 5,000%, the pace would need to accelerate dramatically.
More realistic targets focus on smaller price increases. Current analyst predictions remain in the fractions of a cent range rather than dollar valuations.


