The S&P 500 is a market-capitalization-weighted index that tracks the stock performance of 500 of the largest publicly traded companies listed on U.S. exchanges. New to the markets? Start with our Trading Basics & Concepts library for essential terms and strategies. Created and maintained by S&P Dow Jones Indices, it is widely regarded as the single most representative barometer of the U.S. equity market and a proxy for the broader economy. Because the index covers about 80 percent of the total U.S. market capitalization, its day-to-day moves are closely watched by investors, economists, and policymakers alike. A broader historical context is available in the Wikipedia S&P 500 entry.
You can monitor the real‑time S&P 500 price to see how today’s moves compare with the long‑term trend.
Why the S&P 500 Matters to Investors
Because the S&P 500 captures the performance of blue-chip companies from every major sector, it has become the default benchmark against which professional money managers, mutual funds, and exchange-traded funds (ETFs) measure success.
Index-level trends often influence capital flows: a rising S&P 500 can buoy investor confidence, while a prolonged drawdown tends to tighten credit conditions and dampen consumer sentiment. Importantly, many employer retirement plans use S&P 500-tracking funds as a core holding, so the index’s long-term trend directly shapes Americans’ retirement outcomes.
History of the S&P 500 Index
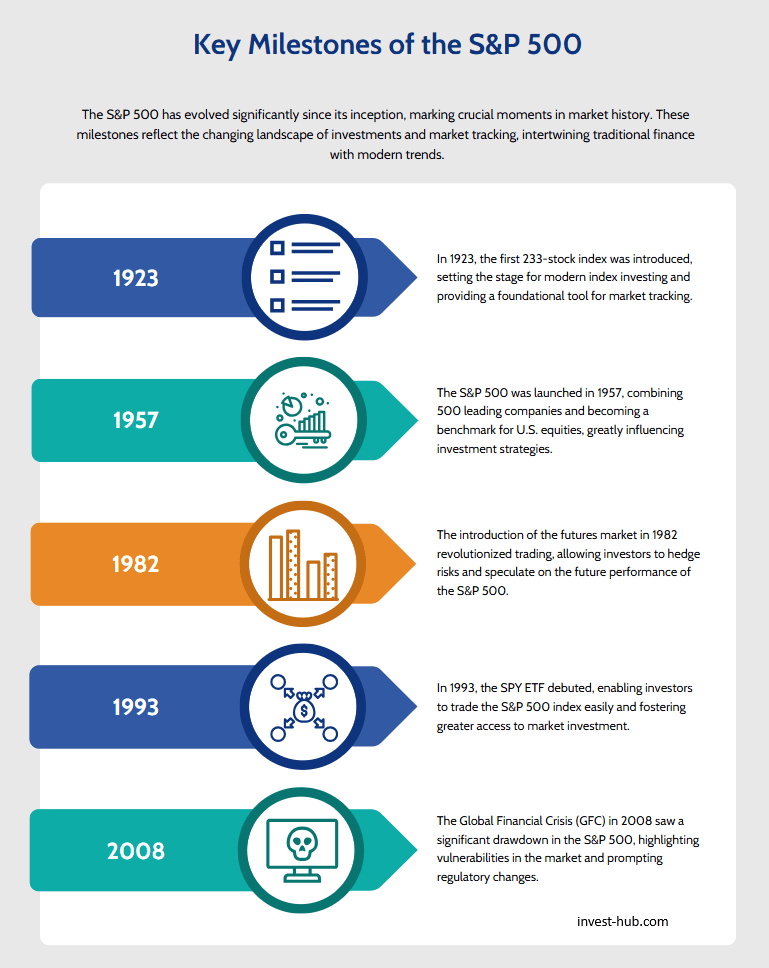
The roots of the S&P 500 trace back to 1923, when Standard Statistics (a predecessor of Standard & Poor’s) created a 233-stock index. In March 1957, the modern S&P 500 launched with—you guessed it—500 companies. The index’s evolution is detailed on the official S&P Dow Jones Indices page.
Crucially, the 1957 redesign adopted market capitalization weighting and an automated data feed, allowing real-time calculation. Over the decades the index has survived wars, oil shocks, bubbles, and bear markets, reinforcing its role as the yardstick of Wall Street.
Notably, in 1982 S&P introduced futures trading on the index, paving the way for today’s vibrant derivatives ecosystem, and in 1993 the first S&P 500 index fund ETF (ticker SPY) debuted, democratizing passive investing.
How the S&P 500 Is Constructed
Eligibility Criteria
A security must be a U.S. company with a primary listing on the NYSE or Nasdaq, boast a market cap above roughly USD 15 billion (“adjusted market capitalization”), maintain adequate liquidity, and post positive earnings in the most recent quarter and across the trailing four quarters. A committee of economists and index specialists meets monthly to assess candidates and removals; membership is therefore earned, not automatic.
Weighting Methodology
Once admitted, constituents are weighted by float-adjusted market capitalization. That means only shares actually available for public trading count, excluding insider and government stakes. Because of capitalization weighting, mega-cap firms such as Apple, Microsoft, and Amazon collectively drive a substantial share of index moves—something investors should remember when gauging “the market.”
Sector Composition
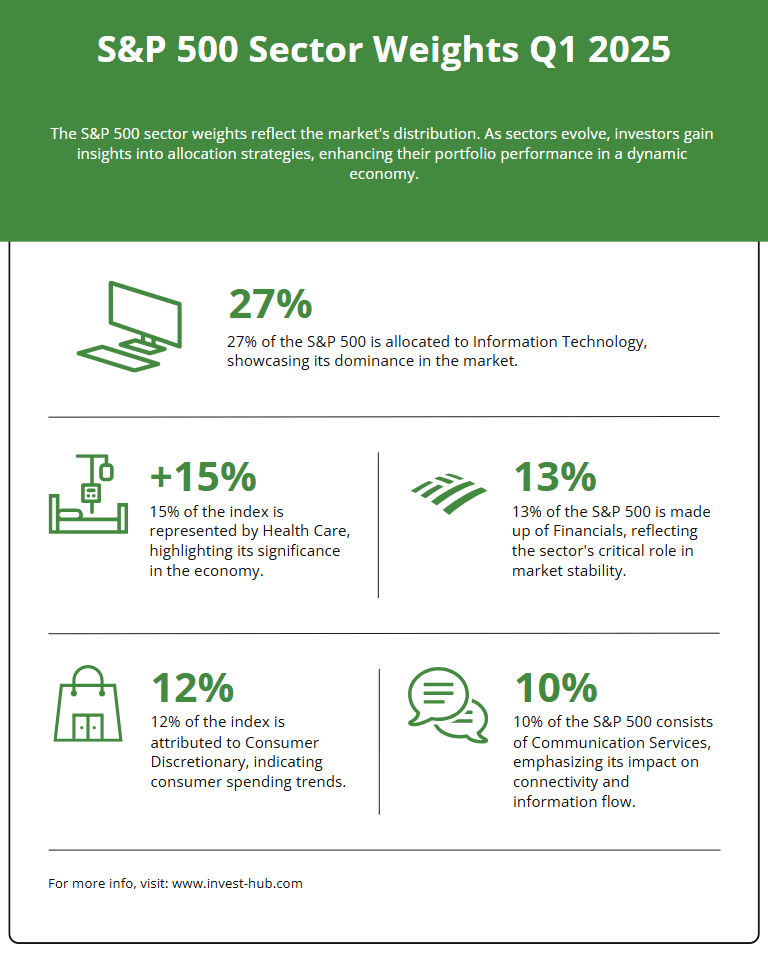
The S&P 500 spans all 11 Global Industry Classification Standard (GICS) sectors. As of early 2025, information technology commands about 30 percent of the index, followed by health care and financials. Sector weights evolve with corporate fortunes and committee reclassifications, such as the 2018 creation of the stand-alone Communication Services sector.
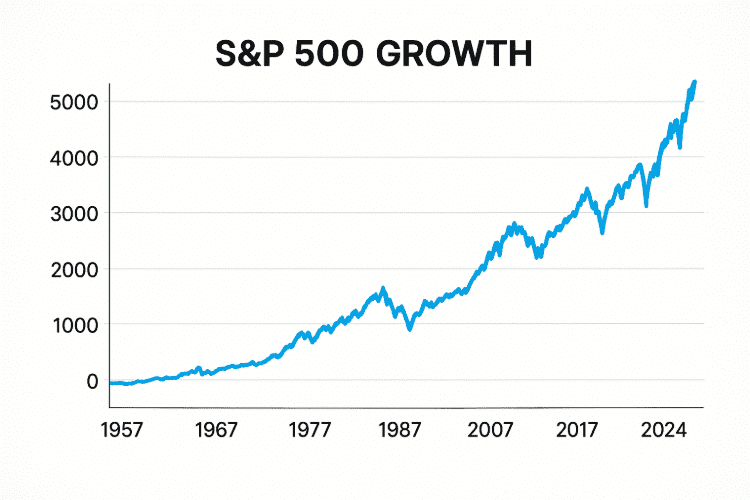
Performance of the S&P 500 Over Time
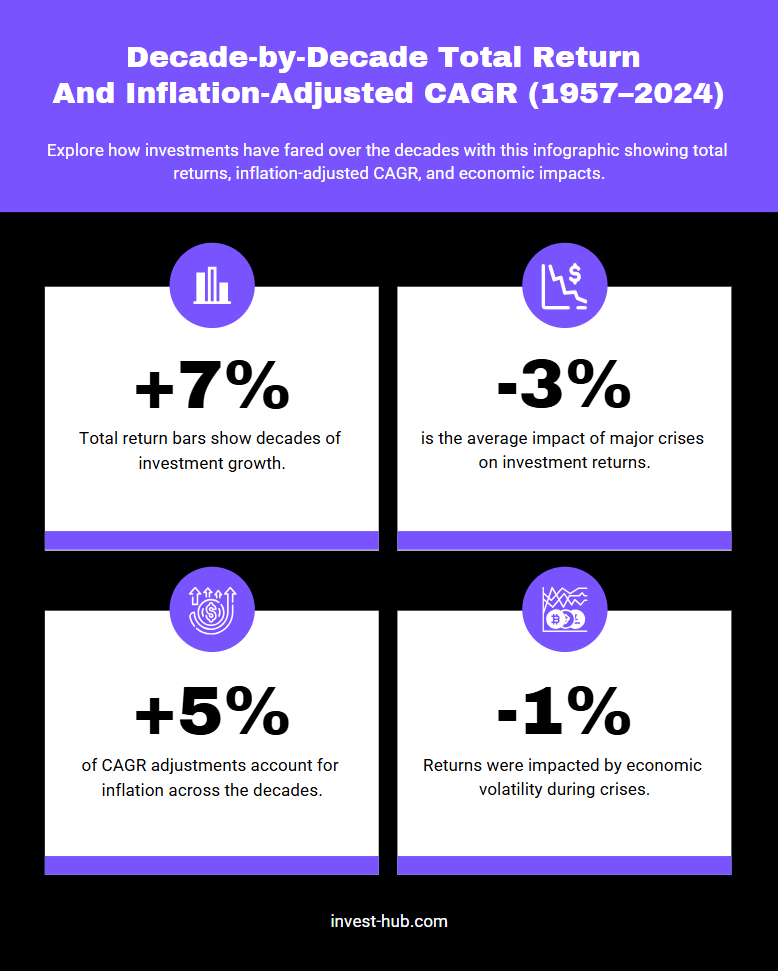
From 1957 through 2024, the S&P 500 delivered a compound annual growth rate (CAGR) of roughly 10 percent, including dividends. That average, however, masks considerable volatility: the index plunged 37 percent in 2008 during the Global Financial Crisis, soared 31 percent in 2019 amid accommodative monetary policy, and dropped more than 19 percent in 2022 as inflation forced the Federal Reserve to tighten aggressively.
Nevertheless, a $10,000 investment made at inception would have grown to well over $5 million by late 2024—clear testimony to the power of long-term compounding.
Investing in the S&P 500
Index Funds vs ETFs
Investors typically gain exposure through low-cost index mutual funds or ETFs that replicate the S&P 500. ETFs trade intraday like stocks and often carry slightly lower expense ratios, while mutual funds may offer automatic dividend reinvestment and fractional purchase features in retirement plans.
Costs and Tax Considerations
The average S&P 500 ETF charges less than 0.05 percent annually—dramatically cheaper than the 1-plus percent fees common among active funds. Still, bid-ask spreads, tracking error, and, for taxable accounts, capital-gains distributions merit attention. Holding a fund in tax-advantaged wrappers such as IRAs can mitigate surprises. Before committing funds, be sure to compare top online brokers for fees, execution quality, and account features.
How to Choose the Right Fund
When comparing funds, scrutinize the expense ratio, replication method (full vs. sampling), securities-lending policies, tracking difference, and issuer stewardship record. For most long-term savers, however, any broad-based S&P 500 tracker paired with regular contributions and patience remains a robust core allocation.
Common Misconceptions About the S&P 500
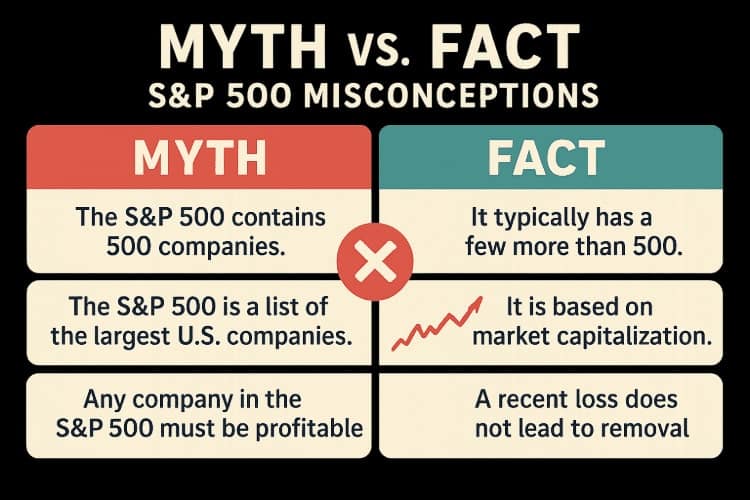
- “It represents the entire U.S. stock market.” While broad, the index omits thousands of small- and mid-cap firms. Total-market funds include those missing names.
- “The S&P 500 always goes up.” Over sufficiently long horizons the trend has been positive, yet multiyear drawdowns are possible and even normal.
- “It is diversified enough on its own.” Diversification across asset classes—bonds, international equities, and alternatives—can cushion periods when U.S. large-caps lag.
- “Buying after a decline is gambling.” , lump-sum investments during bear markets have yielded above-average future returns, provided the time horizon is long.
- “All 500 companies contribute equally.” In reality, the top 10 names account for roughly one-third of the index’s weight, which can concentrate risk.
S&P 500 vs Other Major Indices

Although the S&P 500 is the most quoted benchmark, it coexists with several other indices that serve different purposes.
The Dow Jones Industrial Average, for example, includes just 30 price-weighted blue chips, which means high-priced stocks exert outsize influence regardless of corporate size.
The Nasdaq Composite tilts toward technology and growth firms, thereby exhibiting greater volatility. For a tech‑centric comparison, see the Nasdaq 100 index overview, which tracks the largest non‑financial listings on Nasdaq.
Internationally, the MSCI World Index aggregates large- and mid-cap companies across 23 developed markets. Comparing performance across these benchmarks can reveal style and regional trends, but remember that each index tracks a unique universe and weighting scheme. Use our global indices live dashboard to track markets around the world in one place.
Risks and Limitations of Relying Solely on the S&P 500
Focusing exclusively on a single domestic large-cap index exposes investors to concentration in both geography and sector. Between 2014 and 2024, the information technology allocation in the S&P 500 nearly doubled, meaning that a downturn in tech could materially drag on index returns.
Moreover, U.S. equities account for only about 60 percent of global market capitalization; allocating a portion of assets to international and small-cap segments can reduce home-country bias.
Finally, valuations vary through cycles. The Shiller cyclically adjusted price-to-earnings (CAPE) ratio for the S&P 500 hovered above its long-term average for much of the 2010s, implying lower forward returns than historical norms.
How Companies Enter and Exit the S&P 500
Contrary to popular belief, entry into the S&P 500 is not automatic once a firm crosses the market-cap threshold. The committee considers additional qualitative factors such as balance sheet strength, trading history, and whether share classes have sufficient float.
When companies merge, spin off units, or reincorporate abroad, the committee reassesses eligibility. High-profile inclusions—such as Tesla in December 2020—can generate short-term price surges because passive funds must buy shares to replicate the index. Conversely, deletions can pressure outgoing stocks in the days following the announcement.
The S&P 500 as a Leading Economic Indicator
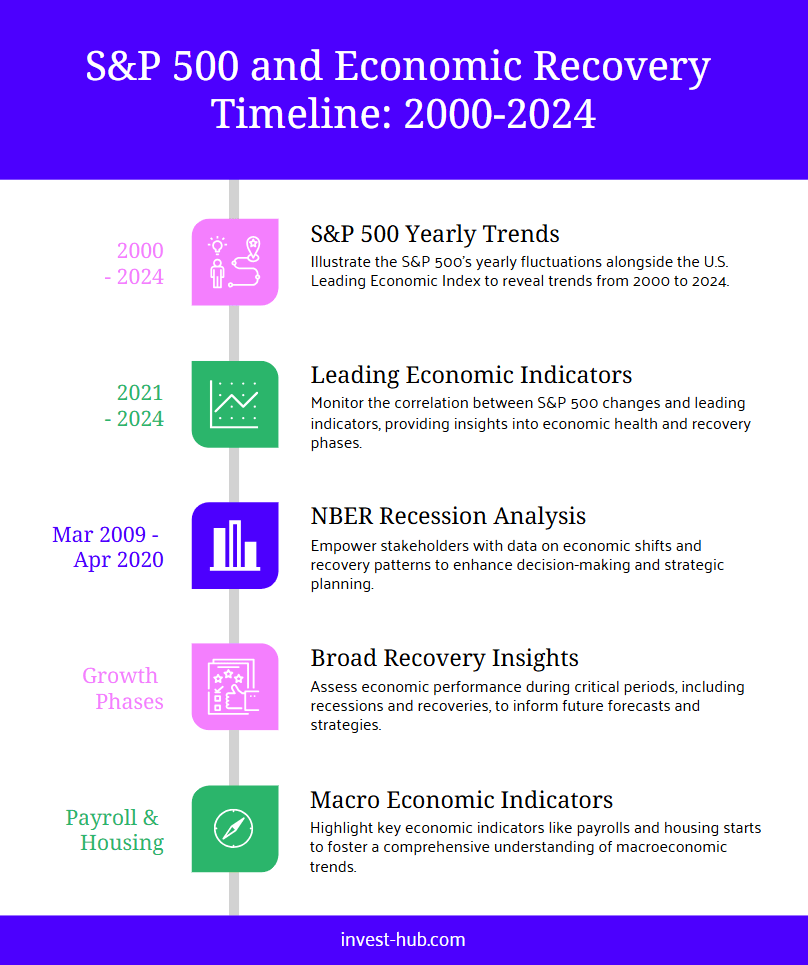
Equity markets discount future earnings, so sustained moves in the S&P 500 often precede turns in the business cycle. Economists incorporate the index into composite leading indicators published by organizations like the Conference Board.
A sharp, prolonged decline can foreshadow recession, while breadth-thrust signals—in which a high percentage of stocks advance simultaneously—frequently mark early-cycle recoveries. That said, market sentiment can overshoot fundamentals, and relying on the S&P 500 alone for macro forecasts may yield false positives. Combining index trends with labor market, housing, and credit data provides a more balanced view.
Strategies for Using S&P 500 Exposure in a Portfolio
Core-Satellite Approach: Many advisors anchor 50–70 percent of an equity allocation in a low-cost S&P 500 fund, then add satellite holdings—such as small-cap, value, or international funds—to tilt toward specific factors or regions.
Dollar-Cost Averaging: Contributing a fixed dollar amount at regular intervals mitigates the risk of investing a lump sum at a market peak. Over time, more shares are bought when prices are low and fewer when prices are high. Public.com’s explainer, ‘What is the S&P 500?’, covers practical buying strategies.
Tactical Overlay: Active investors sometimes reduce S&P 500 weightings during periods of extreme valuation or economic stress, reallocating to cash or alternatives, then rotate back after sentiment washes out. Evidence of success with such market timing is mixed, underscoring the importance of disciplined rules over gut feeling.
Conclusion
The S&P 500 endures as the most watched yardstick of U.S. equities because it couples a rigorous, committee-driven methodology with broad industry coverage and transparent rules. For investors, owning a low-cost fund tracking the index offers instant exposure to the innovative giants—and steady stalwarts—that power the world’s largest economy. Yet remembering that the S&P 500 is neither risk-free nor wholly comprehensive fosters healthier expectations and better-diversified portfolios. For those who prefer a hands-off approach, automating contributions to an S&P 500 index fund can turn market noise into long-term wealth creation, provided one stays invested through inevitable corrections. Diversification and patience remain the indispensable partners of this venerable benchmark, so stay the course.
Frequently Asked Questions
“S&P” abbreviates Standard & Poor’s, the credit-rating company that created the index.
There is no fixed calendar; the index committee meets monthly and adds or removes firms whenever eligibility criteria warrant.
No. Investors gain exposure by purchasing index mutual funds or ETFs that hold the 500 stocks in the same weights as the index.
Over long horizons, large-cap equities have historically outpaced inflation, but short-term performance can vary. Companies with strong pricing power tend to fare best.
The Dow tracks 30 price-weighted stocks, so high-priced shares dominate. The S&P 500 tracks 500 market-cap-weighted companies, making it broader and more representative.
Index funds and ETFs collect dividends from constituent companies and typically distribute them to shareholders quarterly; many platforms offer automatic reinvestment.