Lesson 2: Candlestick Patterns and Chart Reading
Introduction: Mastering Candlesticks for Better Market Predictions
Candlestick charts are the most widely used tool in technical analysis due to their ability to visually convey market sentiment. Each candlestick tells a story about price action during a specific time period, helping traders identify potential reversals, continuations, and trends. In this module, you’ll learn the basics of candlesticks, key patterns, and how to use them in trading.
By the end of this module, you’ll understand:
- The anatomy of a candlestick and what it represents.
- Key bullish and bearish patterns.
- How to use candlestick patterns to predict market behavior.
What Is a Candlestick Chart?
Definition:
A candlestick chart represents price movements over a specific time period, using individual candlesticks to show the opening, closing, high, and low prices.
Why Use Candlesticks?
- Visual Clarity: Easy-to-read format for price action.
- Market Sentiment: Reflects the balance between buyers (bulls) and sellers (bears).
- Universal Applicability: Works across all asset classes and timeframes.
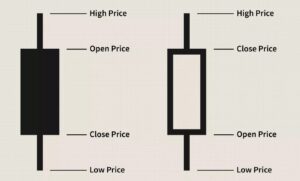
Anatomy of a Candlestick
- Body:
- Represents the range between the opening and closing prices.
- Bullish Candlestick: Close price is higher than open (green/white).
- Bearish Candlestick: Close price is lower than open (red/black).
- Wicks (Shadows):
- The lines extending above and below the body.
- Upper Wick: Shows the high price during the session.
- Lower Wick: Shows the low price during the session.
- Example Diagram:
- A visual showing bullish and bearish candlesticks with labeled parts.

Key Candlestick Patterns
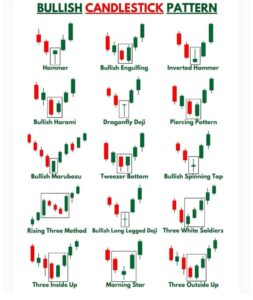
Bullish Patterns (Indicate Potential Price Rises)
- Hammer:
- Small body with a long lower wick.
- Significance: Indicates potential reversal in a downtrend.
- Example: Appears after a series of bearish candles.
- Bullish Engulfing:
- A larger bullish candlestick fully engulfs the previous bearish candlestick.
- Significance: Signals a strong reversal to the upside.
- Morning Star:
- Three-candle pattern: bearish candle, a small indecisive candle, and a large bullish candle.
- Significance: Indicates the end of a downtrend.

Bearish Patterns (Indicate Potential Price Drops)
- Shooting Star:
- Small body with a long upper wick.
- Significance: Suggests a reversal in an uptrend.
- Example: Often appears near resistance levels.
- Bearish Engulfing:
- A larger bearish candlestick fully engulfs the previous bullish candlestick.
- Significance: Signals a strong reversal to the downside.
- Evening Star:
- Three-candle pattern: bullish candle, a small indecisive candle, and a large bearish candle.
- Significance: Indicates the end of an uptrend.
Continuation Patterns
- Doji:
- Open and close prices are nearly identical, resulting in a very small body.
- Significance: Signals indecision in the market, often leading to continuation.
- Spinning Top:
- Small body with long upper and lower wicks.
- Significance: Reflects market uncertainty, often found in consolidating trends.
Using Candlestick Patterns in Trading
1. Identifying Reversals
- Look for hammer or engulfing patterns at support or resistance levels.
- Example: A hammer at a key support level signals a potential upward reversal.
2. Spotting Continuation
- Look for Doji or spinning top patterns within a trend.
- Example: A Doji during an uptrend may indicate a brief pause before the trend continues.
3. Combining with Other Tools
- Enhance accuracy by pairing candlestick patterns with support/resistance and indicators like RSI.
- Example: A bullish engulfing pattern at an oversold RSI level strengthens the buy signal.
Practical Exercise: Pattern Recognition
Scenario:
You’re analyzing the GBP/USD pair and notice a large bearish candlestick followed by a bullish engulfing pattern near a support level.
- Question: What does this pattern indicate?
- Answer: A potential upward reversal.
- Follow-Up: How would you trade this setup?
- Answer: Enter a long position with a stop-loss below the support level.
Real-Life Example: Applying Candlestick Patterns
Case Study:
In early 2023, the S&P 500 showed a bearish engulfing pattern at a key resistance level. Traders who recognized the pattern and entered short positions saw significant profits as the index dropped by 5% over the following week.
Common Mistakes in Candlestick Analysis
- Ignoring Context: Patterns must be analyzed within the broader market context.
- Solution: Always consider trends, support/resistance, and volume.
- Overemphasizing One Candle: Don’t rely solely on a single pattern.
- Solution: Confirm signals with additional tools or patterns.
- Misidentifying Patterns: Beginners often confuse similar-looking patterns.
- Solution: Practice pattern recognition using interactive charts.
Summary: What You’ve Learned
- Candlestick patterns are powerful tools for predicting market behavior.
- Key patterns include bullish (hammer, engulfing) and bearish (shooting star, evening star) setups.
- Combining candlesticks with other tools enhances accuracy and confidence.
What’s Next?
In the next module, Support, Resistance, and Trendlines, you’ll learn how to identify key price levels and use them to refine your trading decisions. Mastering these concepts will help you develop precise entry and exit strategies.