Lesson 1: Foundations of Technical Analysis
Introduction: The Pillars of Technical Analysis
Technical analysis is the backbone of trading, enabling traders to make informed decisions by studying historical price movements. This module introduces the core principles of technical analysis, focusing on its purpose, the tools it uses, and its application in various markets. Whether you’re a beginner or looking to solidify your foundation, this module provides a stepping stone for mastering the art of market analysis.
By the end of this module, you’ll understand:
- The purpose and scope of technical analysis.
- Key concepts such as price action, market trends, and chart types.
- How technical analysis differs from fundamental analysis.
What Is Technical Analysis?
Definition:
Technical analysis is the study of past market data, primarily price and volume, to forecast future price movements. Unlike fundamental analysis, which focuses on economic and financial factors, technical analysis relies purely on market behavior.
Why Use Technical Analysis?
- Identify Trends: Spot bullish, bearish, or sideways trends early.
- Define Entry and Exit Points: Use tools to optimize your trading decisions.
- Universality: Works across all asset classes, including forex, stocks, commodities, and cryptocurrencies.
Core Principles of Technical Analysis
1. Price Action
- Definition: The movement of an asset’s price over time.
- Purpose: Reflects all available information about the market.
- Key Insight: Price action includes everything—trader emotions, economic data, and geopolitical events.
2. Market Trends
- Definition: The direction in which a market is moving over time.
- Types of Trends:
- Bullish Trend: Prices are moving higher (uptrend).
- Bearish Trend: Prices are moving lower (downtrend).
- Sideways Trend: Prices fluctuate within a range.
- Importance: Understanding trends helps traders align their strategies with the market.
3. Chart Types
- Definition: Visual representations of price data over time.
- Types of Charts:
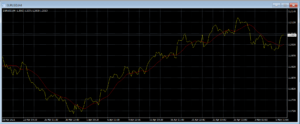
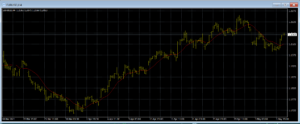
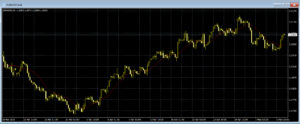
- Line Chart: Connects closing prices over a period.
- Use: Simplistic, ideal for identifying trends.
- Use: Simplistic, ideal for identifying trends.
- Bar Chart: Shows open, high, low, and close (OHLC).
- Use: Provides detailed price data for in-depth analysis.
- Use: Provides detailed price data for in-depth analysis.
- Candlestick Chart: Represents price action using colored bars.
- Use: Most popular chart type for technical analysis.
- Use: Most popular chart type for technical analysis.
- Line Chart: Connects closing prices over a period.
- Interactive Example: Learners identify trends using sample candlestick charts.


Key Differences: Technical vs. Fundamental Analysis
| Aspect | Technical Analysis | Fundamental Analysis |
|---|---|---|
| Focus | Price action and market behavior | Economic data and company performance |
| Goal | Short-term trading opportunities | Long-term investment potential |
| Tools | Charts, patterns, and indicators | Financial statements, GDP, and interest rates |
| Best For | Active traders and speculators | Investors and value-oriented traders |
Example: While a technical trader might focus on a head-and-shoulders pattern to predict a reversal, a fundamental trader might analyze quarterly earnings to assess stock value.
Benefits of Technical Analysis
- Timely Decision-Making: Quickly adapt to changing market conditions.
- Visual Clarity: Charts and patterns make price behavior easier to understand.
- Broad Application: Effective across all financial instruments.
- Objective Trading: Reduces emotional bias by relying on data-driven insights.
Limitations of Technical Analysis
- Subjectivity: Patterns and trends may be interpreted differently by traders.
- Lagging Nature: Indicators often confirm trends after they begin.
- Dependency on Historical Data: Assumes history repeats itself, which may not always hold true.
Practical Activity: Identify a Trend
Scenario:
You’re analyzing the EUR/USD forex pair. The candlestick chart shows higher highs and higher lows over the past two weeks.
- Question: Is this an uptrend, downtrend, or sideways trend?
- Answer: Uptrend, as the prices are consistently moving higher.
- Follow-Up: What would be your trading approach?
- Answer: Look for opportunities to enter long positions during pullbacks.
Real-Life Example: How Technical Analysis Helped a Trader
Case Study:
A trader noticed a bullish trend in the gold market during geopolitical uncertainty. By analyzing candlestick patterns and support levels, the trader entered a long position when gold bounced off a key support level, earning a 10% profit within a month.
Summary: What You’ve Learned
- Technical analysis is a powerful tool for predicting price movements using historical data.
- Key concepts include price action, market trends, and chart types.
- While it has limitations, technical analysis is invaluable for traders seeking data-driven insights.
What’s Next?
In the next module, Candlestick Patterns and Chart Reading, you’ll dive deeper into the most popular chart type: candlesticks. Learn how to interpret bullish and bearish patterns to anticipate market reversals and continuations.